How to Choose the Best Combined Harvester for Global Buyers?
Choosing the right Combined Harvester is rarely a simple matter of comparing horsepower and purchase price. Global buyers face different crops, field sizes, climates, labor costs, transport systems, and dealer capabilities. A machine working through dry wheat in Australia may struggle in humid rice fields in Southeast Asia. Small details matter. Header width, grain-tank capacity, unloading speed, cleaning performance, and service response can change the entire harvest day.
Industry data shows why this decision deserves careful attention. Mordor Intelligence estimates that the global combine harvester market is expanding as farms seek higher productivity and reduced harvesting losses. Fortune Business Insights also identifies precision farming, labor shortages, and replacement demand as major market drivers. However, market forecasts are not purchasing instructions. A growing market does not guarantee that one model fits every farm.
John Fulton, a precision-agriculture specialist at The Ohio State University, has emphasized, “Data must become a management decision.” That principle applies directly to Combined Harvester selection. Telematics may display fuel use, field speed, and grain loss, but buyers must connect those figures with practical outcomes. Can the local technician diagnose faults quickly? Are belts and sieves available before the harvest window closes? Will the machine protect grain quality during a sudden rainstorm?
This guide examines those questions for international buyers. It considers capacity, crop compatibility, automation, operating cost, safety, and after-sales support. Some conclusions may remain imperfect. Field conditions change, and brochure figures can look better than real soil. Careful buyers should test, compare, and question every assumption before signing a purchase agreement.
Set Capacity Targets with 70–80% Field Efficiency and Expected Yield
How to Choose the Best Combined Harvester for Global Buyers?
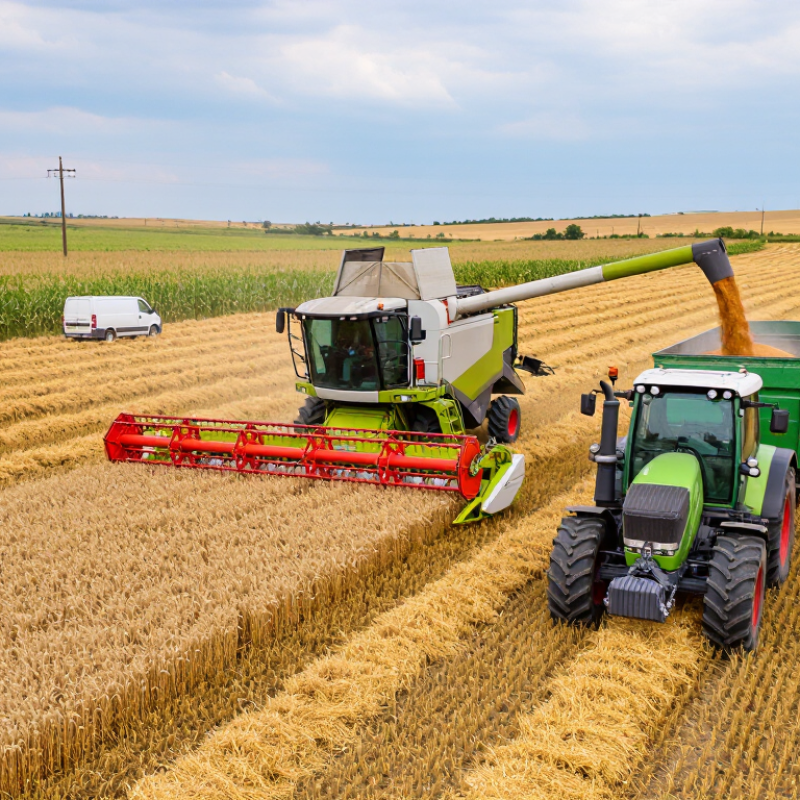
Set capacity targets from field reality, not brochure figures. ASABE EP496.3 shows that field efficiency depends on turning, unloading, transport, and field shape. A practical planning range is 70–80%. For example, a 6-meter header moving at 6 km/h and operating at 75% efficiency covers about 2.7 hectares per hour. That figure is more useful than maximum engine power.
Expected yield must come from credible local evidence. FAOSTAT crop statistics place average global cereal yield near 4 tonnes per hectare, while regional results vary sharply. USDA’s WASDE report has recently estimated world wheat production at roughly 790 million tonnes. Use district-level harvest records when available. A 6-tonne-per-hectare field at 2.7 hectares per hour creates about 16.2 tonnes of crop per hour. Moisture, straw volume, and unloading delays can reduce this output.
Allow working capacity above the planned average. Around 10–20% extra capacity can protect the harvest window, especially where rain arrives quickly. This estimate may still be wrong. Small fields, soft soil, or distant trucks can lower efficiency below 70%. I would test the calculation against three seasons of local records before selecting header width, grain tank size, and engine capacity. Bigger is not always better.
How to Choose the Best Combined Harvester for Global Buyers?
Set Capacity Targets with 70–80% Field Efficiency and Expected Yield
The chart estimates effective field capacity using working width × operating speed × field efficiency ÷ 10. Expected grain throughput combines the effective capacity with representative cereal yields of 4.5–8.0 tonnes per hectare. Actual results vary with crop type, field size, terrain, moisture, unloading time, and operator conditions.
Match Engine Power, Header Width, and Throughput in t/h
How to Choose the Best Combined Harvester for Global Buyers?
Match engine power, header width, and throughput in t/h before comparing prices. ASABE EP496.3 stresses that effective field capacity depends on width, travel speed, field efficiency, and operating conditions. A practical calculation is simple: width × speed × field efficiency × yield ÷ 10. For example, a 7.5-meter header moving at 6 km/h, with 75% field efficiency and 7 t/ha wheat yield, may target about 23.6 t/h. Real output will be lower when grain moisture rises, fields become uneven, or unloading interrupts harvesting. A bigger engine cannot fix poor logistics.
Engine power must support the header, threshing system, terrain, and crop resistance. ASABE D497.7 identifies crop type, moisture, machine load, and speed as major power variables. For a high-yield wheat field, insufficient power may cause speed loss and grain damage. Excess power, however, increases fuel cost and may remain unused in lighter crops. USDA NASS data shows substantial variation in farm scale and crop production, so global buyers should size equipment for their dominant conditions, not an ideal brochure scenario. This is where judgment matters. A perfect match is rare.
Tips: Compare rated throughput with clean-grain throughput. Ask for test conditions, including moisture, yield, field efficiency, and loss percentage. Leave a sensible power reserve, perhaps 10–15%, for hills and wet patches. Also check transport width, service access, and local operator skill. These details often decide whether a theoretical 25 t/h becomes a dependable 18 t/h.
Use the 1% Grain-Loss and 2% Damage Benchmarks for Quality
How to Choose the Best Combined Harvester for Global Buyers?
A reliable combine harvester should be judged by measured grain loss, not brochure capacity. Use 1% total grain loss as a serious purchasing benchmark. This figure is not a universal legal limit. It is a practical quality target for comparing machines under similar crop and field conditions.
The ASABE S396.2 standard provides recognized methods for measuring combine performance, including header and separator losses. Buyers should request field-test records, not only laboratory claims.
Grain damage deserves equal attention. Keep cracked, split, and visibly bruised kernels below 2%. Inspect samples from the grain tank and unloading auger. A simple sieve, moisture meter, and bright inspection tray can reveal problems quickly.
Adjust rotor speed, concave clearance, fan force, and travel speed together. One setting rarely solves everything.
I have seen impressive capacity figures hide poor cleaning performance in damp wheat.
FAO reported that 13.2% of food was lost globally between harvest and retail in 2021. Harvest quality therefore affects more than machine efficiency. It influences storage stability, market grade, and avoidable waste.
Ask suppliers to test the machine in your dominant crop, moisture range, and terrain. Repeat the test after an hour. Results can change. That inconvenient detail matters.
A 1% loss result from dry, uniform fields may not represent real farm conditions. Allow room for honest uncertainty when comparing offers.
Choose Threshing and Cleaning Systems for Crop and Moisture Conditions
How to Choose the Best Combined Harvester for Global Buyers?
The right harvester starts with crop and moisture conditions, not engine size. Wheat at 12% moisture behaves differently from damp rice after overnight rain. Dry crops can crack during aggressive threshing. Wet crops may overload the concave and reduce cleaning efficiency. The settings must match grain variety, straw volume, and field humidity.
The cleaning system deserves equal attention. Check fan adjustment, sieve area, airflow control, and access for daily inspection. A strong fan may remove light material, but it can also eject valuable grain. USDA grain standards use moisture thresholds for commercial grading, yet local buyers may apply stricter limits. Confirm the delivery specification before choosing the threshing system.
Source: USDA Federal Grain Inspection Service, Grain Inspection Handbook.
FAO reported that 14% of global food is lost between post-harvest and retail. Poor threshing and cleaning can contribute to this loss, especially where drying facilities are limited. Source: FAO, The State of Food and Agriculture 2019.
Field checks should include cracked kernels, unthreshed heads, grain loss behind the machine, and dust inside the sample. Operators should test several settings during the first harvesting hours. A fixed factory setting rarely fits every field. That is the uncomfortable part. A technically advanced machine can still perform poorly when operators lack moisture data, spare sieves, or practical training.
Validate Global Compliance, Parts Support, and Total Cost per Hectare
How to Choose the Best Combined Harvester for Global Buyers?
Validate Global Compliance, Parts Support, and Total Cost per Hectare
When evaluating a combined harvester, I begin with documents, not glossy output claims. Ask for the correct conformity certificates, emissions records, safety files, and electrical specifications for your destination market. Requirements can differ between neighboring countries. Confirm the exact machine configuration, because a compliant base model may not match the shipped header or software. Request serial-number traceability and a written warranty process. Do not accept vague promises.
Parts support decides whether a productive week becomes a costly delay. Ask where wear parts are stocked, how orders are tracked, and which components remain available after warranty expiration. Check delivery times for knives, belts, bearings, filters, and electronic sensors. During a farm visit, inspect the service kit and ask a technician to explain common repairs. That practical test matters. However, my own evaluations sometimes overvalue warehouse distance and undervalue technician skill. Both affect uptime.
Calculate total cost per hectare across fuel, labor, maintenance, depreciation, financing, and expected downtime. Use local field capacity, not brochure capacity. A machine covering 25 hectares daily may perform differently in wet soil, fragmented fields, or steep terrain. Include headers, transport, operator training, and seasonal storage. Compare at least three harvest seasons. Early estimates are imperfect. Still, a transparent model exposes expensive assumptions before purchase. Record actual fuel use and repair hours after each season, then revise the calculation.
Article Source:
Have Questions? We're Here to Help!
Give us a call at (864) 989-0566 or send us a message to discuss our testing equipment with an expert.